|
 WM 2010 Tipp-Runde
Statistik:Tausend tote Otter Ergebnisverteilung
|
Sieg |
Remis |
Niederlage |
| Heim : Gast |
48% |
17% |
34% |
Statistik:Tausend tote Otter Ergebnishäufigkeit
| Erg. |
Anteil % |
| 2:1 |
25% |
| 1:2 |
15,6% |
| 2:2 |
10,9% |
| 3:1 |
7,8% |
| 0:2 |
7,8% |
| 1:1 |
6,2% |
| 1:0 |
4,7% |
| 3:0 |
4,7% |
| 2:0 |
4,7% |
| 2:3 |
3,1% |
| 0:1 |
3,1% |
| 1:3 |
3,1% |
| 0:3 |
1,6% |
| 4:1 |
1,6% |
|
|
Statistik:Tausend tote Otter Punkteverteilung
|
Tendenz |
Differenz |
Exakt |
Joker |
| Anzahl |
59% |
31% |
10% |
|
| Punkte |
39% |
41% |
20% |
|
Statistik:Tausend tote Otter Bester/Schlechtester Tipptag
|
Bester Tipp |
Durchschnitt |
Schlechtester Tipp |
| Punkte [Spieltag] |
19 [7] |
8,57 |
1 [6] |
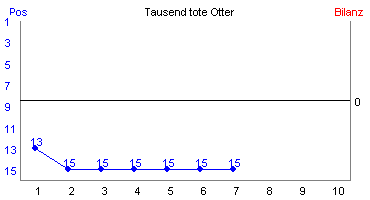
Statistik:Tausend tote Otter Formkurve
|
|
|